

Average used car selling prices in Australian dealers continued their long-term decline during the third quarter of 2024, with the Cox Automotive Australia (CAA) Dealer Delisted Price Index back to January 2021 levels.
However, the critical supply and demand indicators continue to show positive signs, with dealer-used vehicle inventory tracked by CAA up 5.4% year-on-year (YoY) and sales volume up 9.7% year-to-date (YTD).
As has become a familiar pattern, selling prices of older used vehicles remain more elevated over pre-2020 levels than those for younger vehicles. Moreover, traditional passenger hatchbacks and sedans remain more elevated than SUVs, which are in excellent supply.
CAA tracks the most used vehicles sold and listed in Australian dealers, principally through its retail data solutions businesses, such as the SmartPublisher inventory management dashboard.
Used car prices update
The CAA Dealer Delisted Price Index is 129.6, denoting an average 29.6% price increase on all dealer-listed vehicles since the base period of December 2019—volume-weighted and adjusted by MSRP. This is the lowest the Index has been in over 3.5 years, down 6.6% YoY and 12.5% since the market peaked in August 2022.
The latest CAA data shows that 41% of all used cars sold by Australian dealers in the CAA database (as of September) receive one or more discounts while listed for sale, with an average of 7.1% per vehicle. The cumulative YTD figure is 39.6%, suggesting an uptick lately.
However, not all dealer-used vehicles are equal when it comes to softening prices. Comparing relative price changes and residual values across age brackets and vehicle types reveals this.
Total used vehicles sold under 2 years have a current Price Index of 106.5, denoting just a 6.5% increase in selling prices since December 2019. This compares to a current Index of 117.5 for vehicles aged 2-4 years, 127.1 for those aged 5-7 years, and 140.1 for those aged 8-10 years.
Average selling prices for used vehicles aged under 2 years are down 8.2% over the last 12 months (YoY), compared to an 8.6% reduction for cars aged 2-4, a 5.9% reduction for vehicles aged 5-7, and a 4.3% reduction for cars aged 8-10.
“This doesn’t mean older cars cost more outright than younger cars,” CAA Corporate Affairs Manager Mike Costello says.
“But it does suggest that older vehicles are proportionately more inflated relative to longer-term norms than younger cars — a situation driven by high demand for older cars due to cost-of-living, and greater supply of new cars suppressing the value of late-model assets.”
Looked at by vehicle segment rather than age, more pricing patterns emerge. The Price Index for traditional passenger cars (sedans and hatchbacks, etc.) is 144.6, denoting a 44.6% increase since the December 2019 base period. By contrast, the Price indices for other vehicle types are lower: 121.2 for SUVs, 127.2 for utes, 127.9 for vans, and 112.9 for EVs and PHEVs.
Average selling prices for passenger vehicles of all ages are down 3.8% across the last 12 months (YoY), compared to a 7.0% reduction for SUVs, a 9.4% reduction for utes, an 8.3% reduction for vans, and a 2.3% reduction for EVs and PHEVs — from their small sample size.
Residual values
Another way to demonstrate relative price changes in used assets over time is to map changes in average selling residual values (RV%), defined as what the used selling price was as a percentage of the vehicle’s RRP when new.
At a top level, used vehicles aged 2-4 years have an expected RV percentage of 78.3, down from 91.9% two years ago when vehicle shortages inflated prices across the used market. RV percentage has decreased on those cars aged 5-7 years from 73.6 two years ago to 64.6 as of September 2024.
Used car supply update
The topline used vehicle inventory in dealers within the CAA data set is up by 5.6% yearly, meaning more vehicles are available now than last year.
Despite this, the supply of used passenger cars (sedans, hatchbacks, wagons) is down 0.9% YoY, clearly tied to the steady sales decrease for these vehicles in the new market across the past decade. This is a crucial driver of why passenger cars have more inflated Price Indexes.
Year-on-year inventory of used SUVs in dealers is up 6.3%, used ute stocks are up a robust 11.7%, used van inventory has grown 28.5%, and supply of used EVs and PHEVs is up 36.3%. When mapping inventory by type, 47.8% of for-sale used cars in dealers as of September 30 were SUVs, 30.6% passenger cars, 21.1% light commercials, and 0.5% EVs and PHEVs.
Used car sales update
The dealer-used market also shows robust sales figures, up 9.7% YTD (January-September 2024 vs. January-September 2023). The market also showed quarterly growth in Q3, by 8.9% over Q3 of 2023 and 6.1% over Q2 of 2024, respectively.
On a YTD basis, sales of used EVs and PHEVs are up precisely 100%, while used SUV sales are up 14.5%, used ute sales are up 9.9%, and used passenger cars are up 3.3% — linked more to shortages of supply rather than tapering demand, as reflected in their shorter-than-average selling time of 39 days per unit.
Top-selling dealer-used cars YTD:
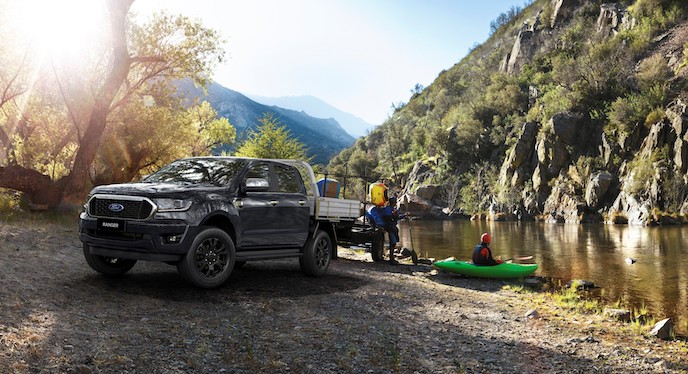
1. Ford Ranger: Up 25.9%
2. Toyota Hilux: Up 5.5%
3. Toyota Corolla: Up 36.9%
4. Toyota RAV4: Up 29.6%
5. Hyundai i30: Up 1%
Toyota Corolla and RAV4 sales are particularly up YoY, with sales of Corollas aged 2-4 up 72.4% and RAV4s aged 2.4 up 46.8% after COVID-era shortages. This explains their decrease in selling prices across 2024.