
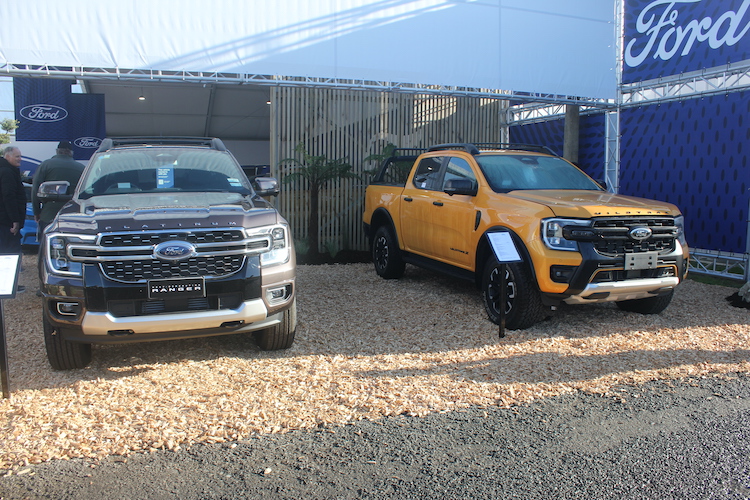
In the last 12 months the Ford Ranger achieved 63,356 registrations, overtaking the Toyota Hilux on 61,111 units registered to become Australia’s best-selling new vehicle in 2023.
It’s the first time in 28 years that a Ford vehicle has taken the title of Australia’s best-selling vehicle.
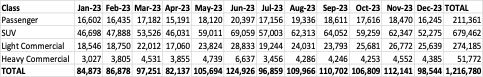
Total sales of the Ranger in 2023 were up 33% on 2022 – as part of the biggest year yet for car sales on record. A total of 1,216,780 vehicles were delivered during the year, the previous highest sales result of 1,189,116 was achieved in 2017.
In third place was the Isuzu D-Max Ute (31,202) followed by the Toyota RAV4 (29,627), the MG ZS (29,258), the Tesla Model Y (28,769), the Toyota Landcruiser (26,449), the Mitsubishi Outlander (24,263), the Mazda CX-5 (23,083) and the Hyundai Tucson (21,224).
There were 24 selling days in December 2023 compared to 25 in December 2022 and this resulted in an increase of 589.2 vehicle sales per day.
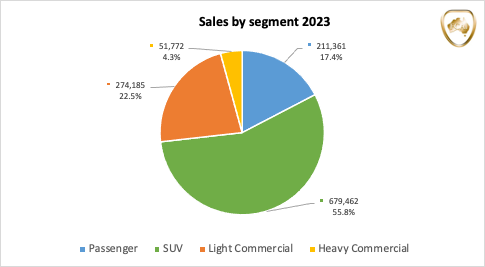
The Passenger Vehicle Market is up by 1304 vehicle sales (8.7%) over the same month last year; the Sports Utility Market is up by 3180 vehicle sales (6.5%); the Light Commercial Market is up by 6094 vehicle sales (31.2%) and the Heavy Commercial Vehicle Market is up by 46 vehicle sales (1.1%) versus December 2022.
Toyota was market leader in December, followed by Ford and Mazda. Toyota led Ford with a margin of 9,455 vehicle sales and 9.6 market share points.
2023 Sales results
| Report for the Month of | Year to Date | Year to Date | Month | |||||
| December 2023 YTD | Dec-23 | Dec-22 | Dec-23 | |||||
| Standings | Marque | Volume | Share | Volume | Share | Volume | Share | |
| 1 | ▼ | Toyota | 215,240 | 17.7% | 231,050 | 21.4% | 19,281 | 19.6% |
| 2 | ▲ | Mazda | 100,008 | 8.2% | 95,718 | 8.9% | 6,765 | 6.9% |
| 3 | ▲ | Ford | 87,800 | 7.2% | 66,628 | 6.2% | 9,826 | 10.0% |
| 4 | ▼ | Kia | 76,120 | 6.3% | 78,330 | 7.2% | 5,583 | 5.7% |
| 5 | ▲ | Hyundai | 75,183 | 6.2% | 73,345 | 6.8% | 4,887 | 5.0% |
| 6 | ▼ | Mitsubishi | 63,511 | 5.2% | 76,991 | 7.1% | 5,134 | 5.2% |
| 7 | ▲ | MG | 58,346 | 4.8% | 49,582 | 4.6% | 3,834 | 3.9% |
| 8 | ▲ | Tesla | 46,116 | 3.8% | 19,594 | 1.8% | 2,192 | 2.2% |
| 9 | ▲ | Subaru | 46,114 | 3.8% | 36,036 | 3.3% | 3,623 | 3.7% |
| 10 | ▲ | Isuzu Ute | 45,341 | 3.7% | 35,323 | 3.3% | 3,987 | 4.0% |
Summary by Class: