According to the Cox Automotive Australia (CAA) Price Index, August 2024 was the sixth consecutive month in which dealership-used vehicle selling prices cooled.
The Price Index, which started at 100 points in December 2019, is now at 130.7, down 7.4% from the same point in 2023 and 11.7% over the past two years.
CAA collects retail data on most dealer-listed used cars in Australia, mainly through its digital inventory management platform, SmartPublisher.

Dealer used vehicle supply for August 2024
Dealer inventory in the CAA database declined slightly in July but remains 6.1% greater than in 2023. Of more significant note, the number of listed vehicles used has increased by more than 30% in the past 24 months.
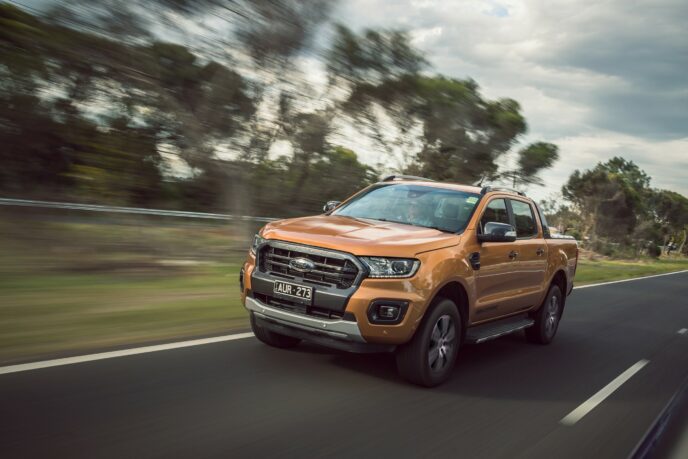
The greater availability of used vehicles is partly due to all-time sales records in the new market, which are driven by backorders and robust pipelines. The most stocked used vehicles in dealers are the Ford Ranger, Toyota Corolla, Toyota Hilux, Toyota RAV4, and Mitsubishi Triton.
Because trends in the new market eventually impact the used market, dealer-used inventories increasingly contain fewer traditional passenger cars (hatchbacks, sedans, etc.) and more SUVs.
As of August 2024, passenger vehicles had a circa 30% share of used inventory, down from 39% at the start of 2020. SUVs have trended in the other direction, with a 49% inventory market share in August 2024 versus 41% at the beginning of 2020.
While still a small percentage of overall stock, the supply of second-hand EVs and PHEVs is up 65% year over year and 120% over the past two years.
Dealer used vehicle demand for August 2024
While dealer-used supply levels are up, so are sales, with the August tally up 11.2% YoY, the most significant result since November 2020.
The industry’s Market Days’ Supply measure declined from 62 days in August 2023 to 61 days in August 2024. The MDS figure was 64 days as recently as January 2024.
Used SUV sales were up 13.5% YoY, and ute sales were up 16.4%, but passenger car sales were largely stagnant over the past 12 months, up a modest 1.6%. This is down to relative scarcity rather than lack of demand, with passenger vehicles having the shortest average selling days (38) of any vehicle type.
While overall EV and PHEV sales remain small, sales have increased by 138.6% this year. The Tesla Model 3 is doing much of the heavy lifting, with sales up 88.6% in August 2024 (over July) and tracking up 50% YTD.
The top-selling vehicles in the dealer-used market for the month were the Ford Ranger (up 5.6% MoM), Toyota Hilux (up 13.8%), Toyota Corolla (up 6.4%), Toyota RAV4 (up 5.6%), and Hyundai i30 (up 2.8%).
Dealer used vehicle prices for August 2024
The CAA Price Index is now back at February 2021 levels and has declined for 17 of the previous 18 months. The average dealer discount was 7.1% per vehicle in August, with 41.7% of all delisted cars receiving one or more price changes online.
Two overarching patterns are emerging in terms of used car pricing: The first is that traditional passenger cars hold more inflated prices relative to pre-COVID levels than SUVs and light commercials.
Passenger Cars (hatches, sedans, wagons, etc.) are more elevated relative to pre-COVID, with a Price Index of 145.7 compared to 122.2 for SUVs and 128.0 for Utes. The Index for Passenger Cars has also declined slower over the past 12 months than other vehicle types.
Another point of note is that the relative prices of older vehicles tend to be more inflated compared to pre-COVID levels than those of younger ones. For example, sedans and hatchbacks aged 2-4 are up 24.6% on their Index since December 2019, whereas those aged 8-10 are up 54.6%.
Two factors are likely behind this: First, there’s a great deal of market demand for older and cheaper vehicles due to current household cost-of-living pressures, and second, there’s a lot of supply of new cars now, which naturally compresses what a dealer can charge for, a late-model used car.
Manheim in August and YTD
Manheim wholesale auction volume—excluding salvage and industrial—grew more than 30% in August YoY and is 42% higher than in the same January to August period in 2023.
August was the second-largest sales month this year after July, with volumes running at four-year highs.
In addition to the strong fleet lease sales growth (up 47% YoY), Manheim is also observing strong volume upticks in vehicles being sold on behalf of OEMs (up 71%, including dealer-only and public auctions), dealers (up 48%), government departments such as QFleet (up 47%), and rentals (up 56%).
The volume increases YoY are consistent across Australia, with the most significant incremental volume coming through Melbourne (up 46%) and Brisbane (up 51%). Manheim is also seeing strong percentage growth in Adelaide (43%), Darwin (86%), Hobart (20%), Newcastle (30%), Perth (43%), and Sydney (20%).
Average wholesale prices are down 7.6% this year and around 20% since the middle of 2022, when vehicle shortages drove up transaction prices.


